
Interface Tour
RayMol provides a native macOS, iPadOS, and iOS interface designed for structural biology. It pairs a high-performance Metal 3D graphics engine with native SwiftUI controls and an embedded PyMOL core.
The Window Layout
Section titled “The Window Layout”On macOS and iPad (landscape), the window is divided into three main operational areas:
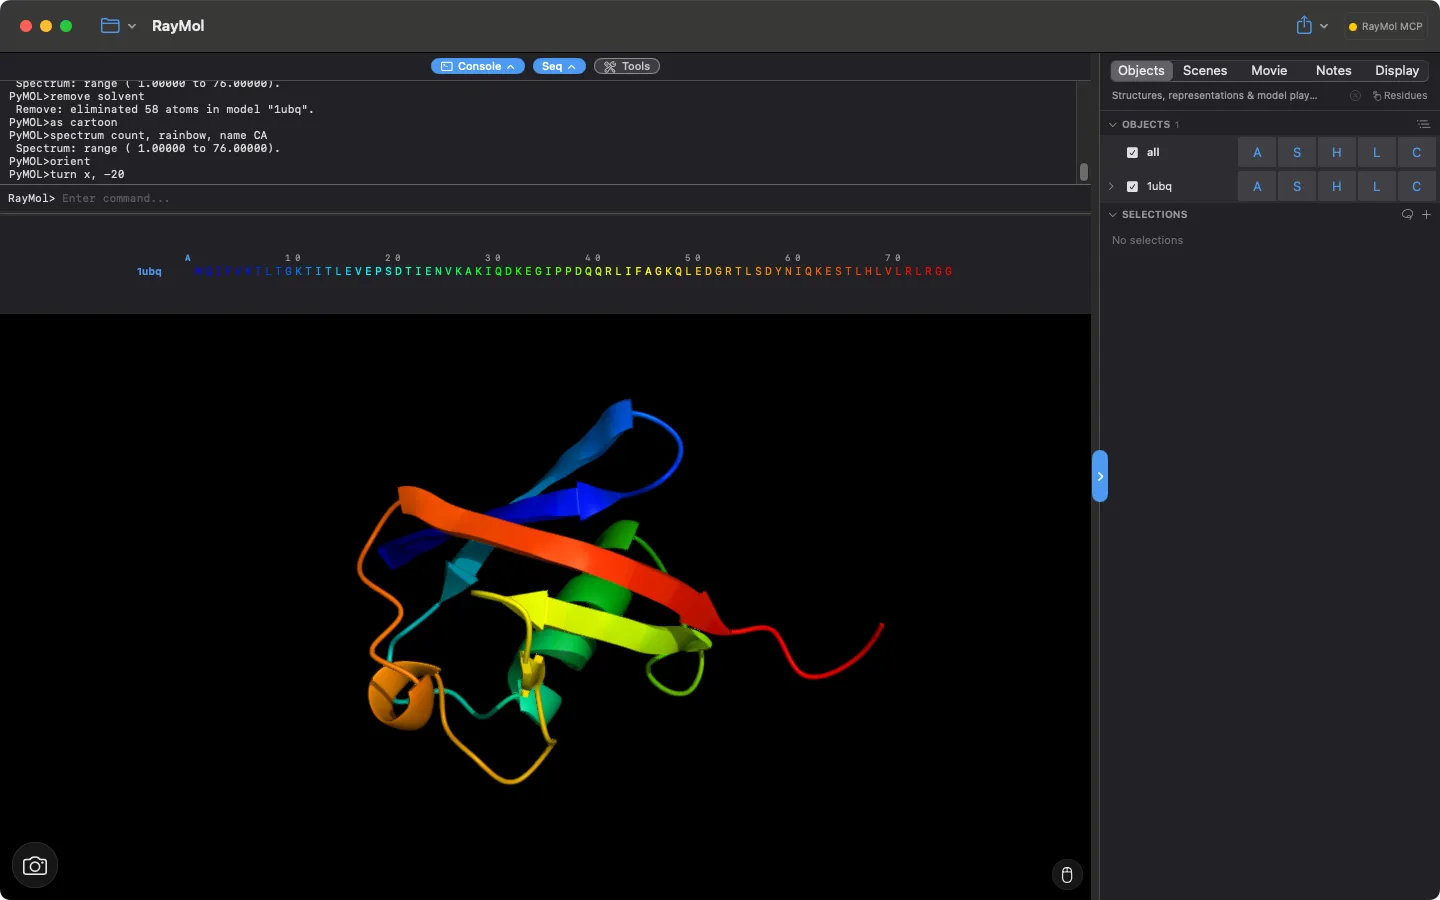 The RayMol window: top rail with Console / Seq / Tools pills, console and sequence panes, the 3D viewport, and the Inspector (Objects tab) on the right.
- Top Rail & Toolbar: Houses file operations (Open and Export on macOS; Open, Save, Export on iPad and iPhone), pane visibility pills (Console, Seq, Tools), and active background task indicators.
- 3D Viewport: The central canvas where molecular structures are rendered, selected, and transformed.
- Inspector Panel: The collapsible right-hand column featuring tabbed access to objects, scenes, movies, analysis notes, and display settings.
3D Viewport
Section titled “3D Viewport”The viewport provides hardware-accelerated rendering powered by Apple Metal:
- Touch and gesture navigation: Rotate with single-finger drag or left-click drag; pan with two-finger drag or middle-click drag; zoom with pinch or right-click drag; roll with a two-finger twist (iOS, or the macOS Trackpad mouse mode); and adjust slab clipping with a three-finger drag (iOS) or Shift + right-drag / Shift + two-finger trackpad drag (macOS).
- Drag-and-drop loading: On macOS, drag
.pdb,.cif,.mmcif, or.psefiles from Finder onto the viewport to load them into the current session. - Hover readout chip: Displays the identifier of the atom, residue, chain, or object currently under the pointer in the upper-right corner of the viewport.
- Hover indicator: Subtly highlights the targeted residue in cyan before clicking, allowing accurate picking without altering existing selections.
- Camera dock: Tap the camera button at the bottom-left of the viewport to open Lens (35 mm-equivalent, with an Ortho toggle), Zoom, and Depth (depth of field).
Inspector Sections
Section titled “Inspector Sections”The inspector groups session controls into five tabs accessible via the segmented switcher (macOS and iPad) or bottom tab bar (iPhone):
- Objects: Lists loaded structures, molecular groups, named selections, and sequence alignments. Provides per-object visibility toggles and representation menus.
- Scenes: Stores and recalls camera angles, representations, and object positions. Includes an option to display glanceable scene buttons directly in the viewport.
- Movie: Authors camera keyframes, scene transitions, and multi-state trajectory animations using the timeline panel.
- Notes: A Markdown laboratory notebook linked to the active session. Embeds interactive camera links, scene snapshots, and structural residue contacts.
- Display: Configures canvas parameters, background color, lighting rigs, depth of field, outlines, shadows, real-time ambient occlusion, and Theme Studio.
Object Rows & Action Menus
Section titled “Object Rows & Action Menus”Each molecular structure in the Objects inspector is represented by a row containing a visibility checkbox, the object name, and five dedicated action buttons: A, S, H, L, and C.
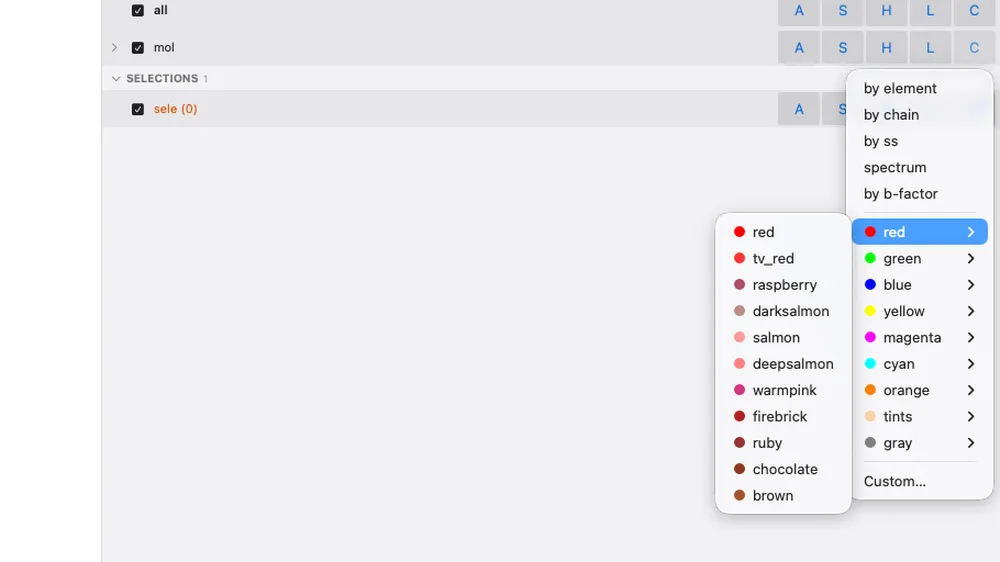 The C menu of an object row.
- Visibility checkbox: Tapping the checkbox or row title toggles rendering on or off (
enable/disable). - All row: Positioned at the top of the list to simultaneously toggle or modify every loaded object in the session.
- A (Action): Manages object lifecycle, camera centering (Zoom, Center, Orient), standard presets (Pretty, Publication, Ball and stick), contact analysis (Find polar contacts, Salt bridges, Halogen bonds), structural alignment, hydrogen manipulation, and physical property computation.
- S (Show): Displays molecular representations, including Cartoon, Sticks, Spheres, Surface, Side chains, Ribbon, Mesh, Dots, and Labels.
- H (Hide): Selectively hides individual representations or cleans up the view with Everything.
- L (Label): Attaches 3D labels to atoms, residues, chains, or properties.
- C (Color): Colors atoms by element, chain, secondary structure, B-factor, spectrum ramps, or curated uniform color palettes.
Hierarchical Groups
Section titled “Hierarchical Groups”Organize complex assemblies into collapsible groups using the group command or A ▸ Move to Group ▸ New Group…:
- Groups display an expandable disclosure chevron and indented child rows (groups can nest; indentation stops increasing after three levels).
- The group visibility checkbox provides a three-state indicator: checked (all children enabled), empty (all children hidden), or mixed (some children visible).
- Group action menus permit bulk camera framing, ungrouping, or deleting the entire collection.
Sequence Panel
Section titled “Sequence Panel”Open the sequence panel by clicking the Seq rail pill, choosing View ▸ Show Sequence, or pressing ⌘2.
- The panel docks directly above the viewport and displays one-letter amino acid and nucleic acid sequences grouped by chain.
- Click or drag across residues in the sequence strip to create or expand the active selection.
- The panel height can be resized by dragging the splitter hairline between the sequence viewer and the viewport.
Command Console
Section titled “Command Console”Access the integrated PyMOL and Python terminal by clicking the Console rail pill, choosing View ▸ Show Console, or pressing ⌘1.
- Log & Input: Displays command output, error traces, and script execution logs. Enter native PyMOL commands or Python one-liners directly at the prompt.
- History & Autocomplete: Press
↑and↓to cycle through command history; pressTabto complete command names and object identifiers (on iPad and iPhone, use the ↑ and ⇥ buttons beside the input). - Smart punctuation normalization: Automatically converts iOS and iPadOS curly quotes and em dashes back to ASCII quotes and hyphens so scripts run without syntax errors.
- Resizable divider: Drag the divider bar beneath the console to expand the log viewing area.
Tools Menu & Interaction Modes
Section titled “Tools Menu & Interaction Modes”The Tools menu (macOS menu bar) and the toolbar Tools button’s menu house RayMol’s interaction modes. Entering any mode temporarily reassigns viewport pointer actions:
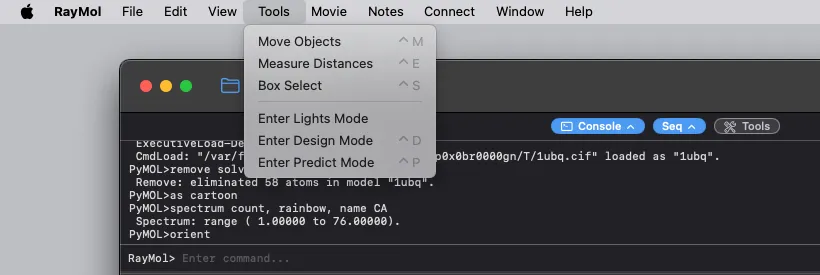 The Tools menu (menu bar) with the interaction modes and their shortcuts.
- Move Objects (
⌃M): Displays a 3D coordinate gizmo to translate and rotate individual structures in space. - Measure Distances (
⌃E): Accumulates viewport atom picks to compute distances, angles, and dihedral torsions. - Box Select: Draws a 2D rectangle to select enclosed atoms. Box Select is in the macOS Tools menu (
⌃S) and, on any platform, behind the lasso icon in the Selections header; it is not in the toolbar Tools button’s menu. - Lights Mode (beta, not yet released): Activates direct manipulation of scene lighting angles, spot direction, and atmosphere via Tools ▸ Enter Lights Mode (macOS) or Lights in the toolbar Tools button’s menu.
- Enter Design Mode (
⌃D): Launches on-device ProteinMPNN sequence design and mutation scoring (requires iOS 18+ on iPhone/iPad). - Enter Predict Mode (
⌃P): Runs on-device structure prediction (requires iOS 18+ on a physical iPhone/iPad device).
Pressing Esc (macOS) or clicking the mode banner’s close button returns the viewport to standard viewing mode.
Hover Readout & Progress Tray
Section titled “Hover Readout & Progress Tray”- Hover Readout Chip: Positioned in the upper-right corner of the canvas. Reports the atom name, residue number, chain, and parent object under the pointer according to the active selection granularity.
- Progress Tray: Sits above the viewport to track non-blocking background operations, including model weight downloads, structure predictions and design runs. Tasks can be canceled directly from the tray.
Grid Mode
Section titled “Grid Mode”Enable multi-structure comparison by turning on Grid in the Display tab’s Canvas group, or set grid_mode, 1:
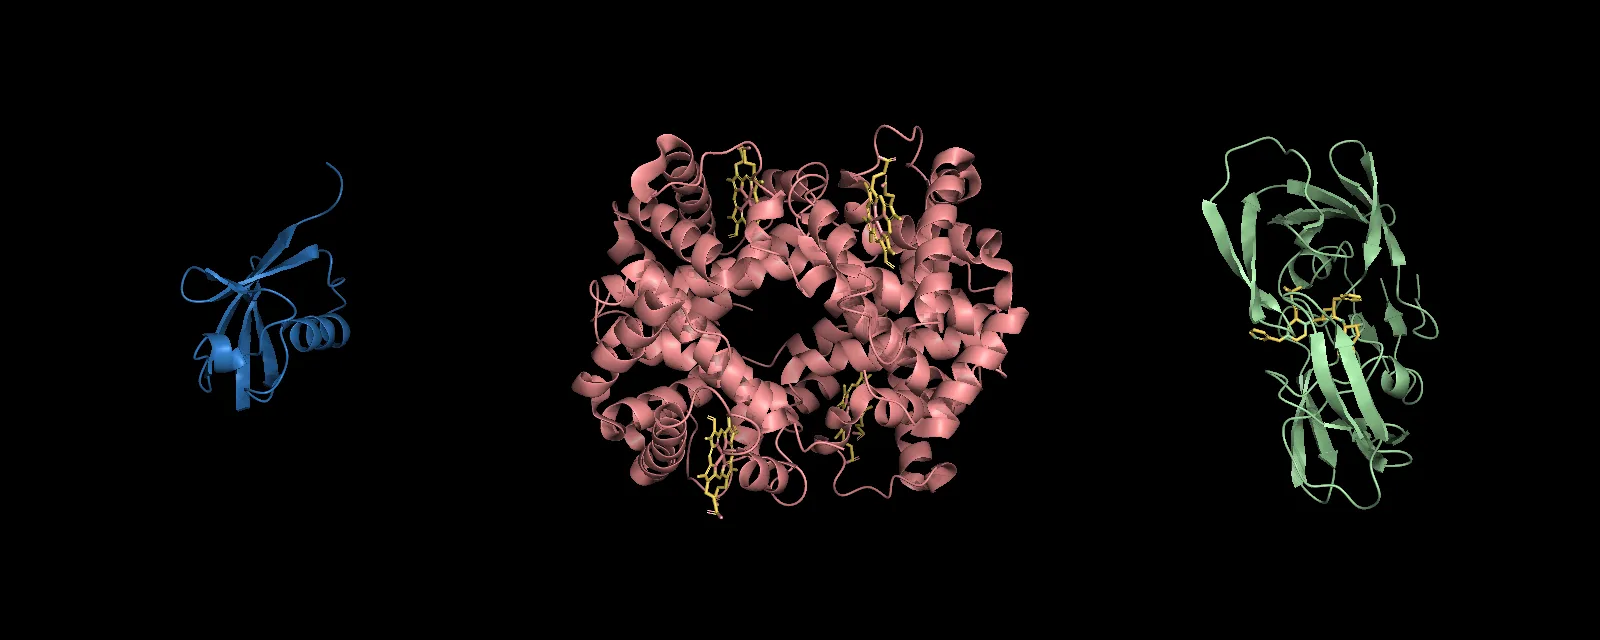 Grid mode: each object drawn in its own cell with a shared camera.
- Rather than superimposing all structures at a common origin, Grid Mode tiles each loaded object into its own discrete viewport cell.
- Camera transformations and lighting interactively synchronize across grid cells, simplifying comparative analysis of homologs and conformational ensembles.
Theme Studio
Section titled “Theme Studio”Customize RayMol’s visual appearance by selecting Theme Studio… in the Display inspector tab:
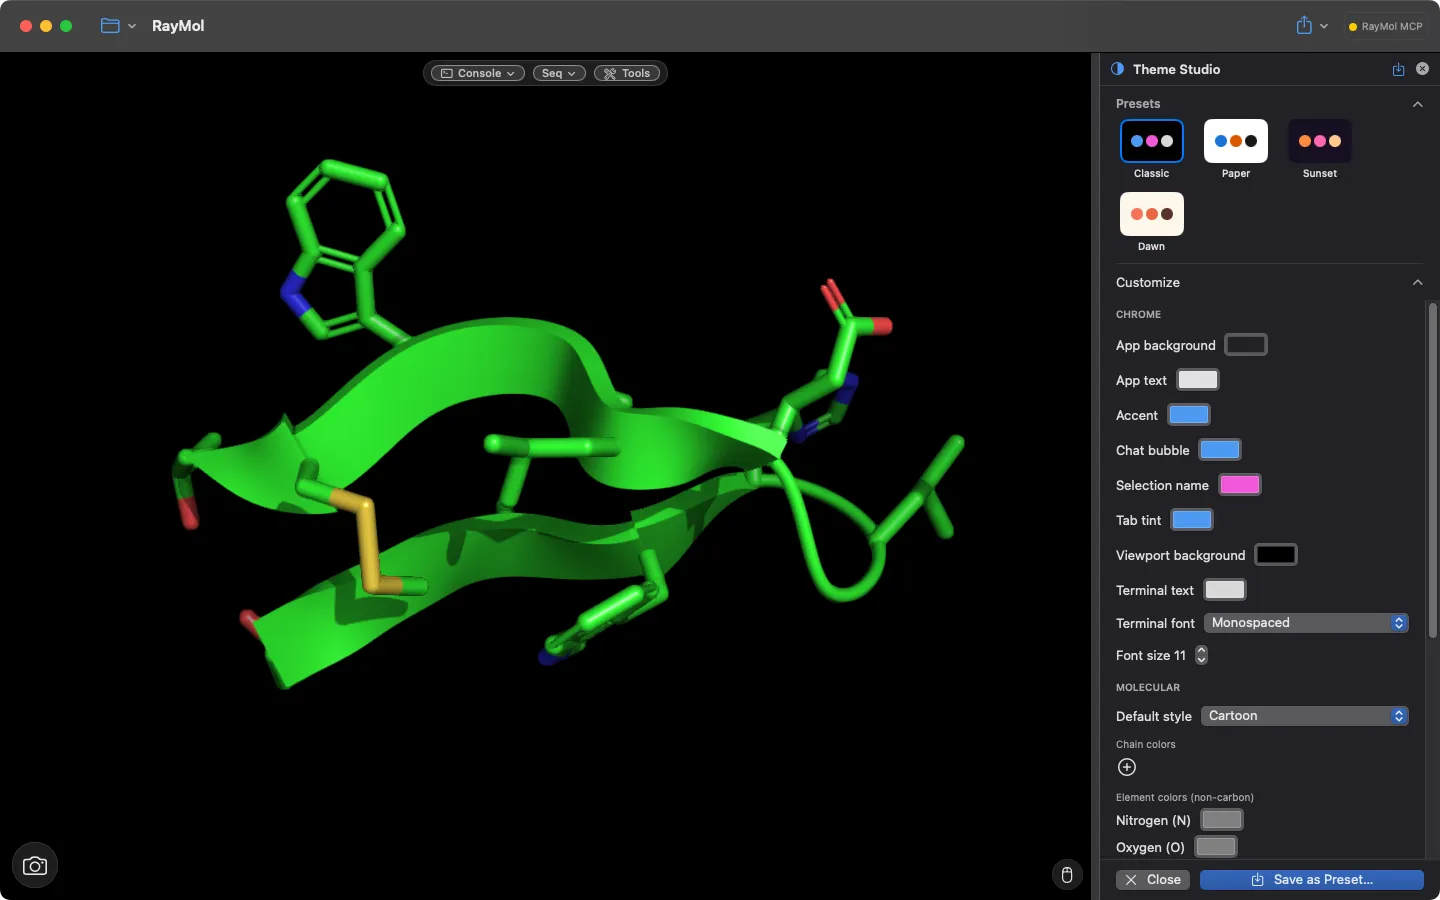 Theme Studio.
- Application chrome: Customize accent colors, inspector backgrounds, tab tints, and console text colors and fonts.
- Molecular styling: Adjust default chain cycle palettes, heteroatom element colors, and default representations (Cartoon, Sticks, Spheres, Ball & Stick, Surface).
- Renderer defaults: Toggle silhouettes, flat beta-sheets, fancy helices, and real-time shadows and ray tracing.
- Save custom styling as reusable presets or restore factory themes at any time.
Context Menus
Section titled “Context Menus”Right-clicking (macOS) or long-pressing (iOS/iPadOS) in the viewport reveals a contextual action sheet:
- Over an atom or residue: Provides quick options to Zoom to residue, Select residue, Label residue, Hide residue, Center here, Auto-lock focus, or apply a quick Color.
- Over empty space: Offers one-tap actions to Reset view or Deselect all.
To learn more about selecting and transforming molecules, see Selecting, Measuring & Moving.