
Object Metrics
Object Metrics keeps the numerical outputs a tool measured directly beside the structure it measured them on. A structure prediction reports per-residue confidence (pLDDT), predicted aligned error (PAE), interface scores, and execution runtime, while a sequence design pass reports native fit and sequence certainty per residue.
All measurements stay attached to the molecular object, persist inside saved .pse session files, and can be inspected, recolored, queried via Python or PyMOL commands, and exported to JSON or CSV long after a calculation completes.
Key concepts
Section titled “Key concepts”Metrics travel with the object
Section titled “Metrics travel with the object”In traditional PyMOL workflows, per-residue numerical data is frequently stuffed into the B-factor column or written to transient atom properties (p.*). Both approaches lose crucial context:
- The B-factor column is a view, not storage: It holds a single scalar per atom. Coloring by a second measurement or running
spectrum countoverwrites whatever was there. In RayMol, metrics are stored in a dedicated run store attached to the object, and the B-factor column is merely a temporary display surface used when coloring. - Atom properties lack provenance: While atom properties can hold per-atom tags, they do not track execution runs, timestamps, units, or tool options. Furthermore, atom properties cannot represent state-level scalars (such as inference runtime or mean PAE) or pairwise matrices (such as PAE), and they do not survive a
.psesession save. - Multiple runs coexist: An object can hold many runs simultaneously. Folding a sequence with Structure Prediction, refolding it with a deeper multiple sequence alignment, and evaluating it with Sequence Design produces three separate runs. None overwrites another.
Measurement scopes
Section titled “Measurement scopes”Every metric is recorded under a declared scope that defines what entity it describes:
| Scope | Entity described | Examples |
|---|---|---|
object |
The object as a whole (identical across models/states) | n_residues, n_chains |
state |
A specific model or coordinate set | mean_plddt, elapsed_s, peak_bytes, mean_pae, min_ipsae |
chain |
A specific chain (optionally within a state) | msa_depth |
residue |
An array indexed by (chain, resi) |
plddt (prediction confidence), native_fit, certainty |
pair |
A pairwise matrix indexed by (chain, resi) × (chain, resi) |
pae (predicted aligned error) |
This hierarchy ensures multi-model predictions (n_models > 1) and complex multimers are represented accurately without flattening or ambiguous averaging.
Tools that produce metrics
Section titled “Tools that produce metrics”Several built-in RayMol tools register and record metrics:
Structure prediction
Section titled “Structure prediction”Running Structure Prediction with Boltz-2 (boltz2, boltz2-bf16) produces:
- Confidence scores:
plddt(per-residue predicted lDDT, 0–100),mean_plddt(state-level mean confidence),pae(pairwise predicted aligned error matrix, 0–32 Å), andmean_pae(mean off-diagonal PAE). - Interface assessment: For multi-chain complexes, predictors report
min_ipsae(minimum interface predicted TM-score / ipSAE across both directions; the primary gate metric for interfaces),ipsae(maximum ipSAE), andipae(mean inter-chain PAE, where values below 10 Å typically mark confident interfaces). Single-chain predictions omit interface metrics. - Runtime and provenance:
elapsed_s(inference runtime),peak_bytes(peak memory usage),n_residues,n_chains, andmsa_depth(per-chain sequence alignment depth).
Protenix does not write to the metric store yet; its pLDDT arrives in the B-factor column only.
Sequence design
Section titled “Sequence design”Opening Sequence Design with ProteinMPNN evaluates the backbone and records:
native_fit: Log-probability assigned by ProteinMPNN to the amino acid present in the input structure, scored leave-one-out against the backbone (expected range: -6.0 to 0.0 log P; higher is better).certainty: Sequence certainty based on Shannon entropy over the amino acid distribution ($1 - H / \ln 21$, where 0 is flat and 1 is one-hot).
Viewing metrics in the user interface
Section titled “Viewing metrics in the user interface”Metrics are integrated directly into RayMol’s interactive workflow:
- Live coloring in Design mode: When entering Design mode, residues are colored in real time by ProteinMPNN fit or certainty. Hovering over a residue displays its propensity scores.
- Structure Prediction visual feedback: When a prediction completes, per-residue confidence is automatically mapped onto the generated structure.
- Coloring commands: You can project any stored per-residue metric back onto the 3D structure using the
metrics_colorcommand.
Command reference
Section titled “Command reference”RayMol provides a suite of commands for interacting with the metric store from the console or scripts. For general command syntax, see the PyMOL Commands & API reference.
metrics_list
Section titled “metrics_list”Lists all measurement runs recorded in the current session.
metrics_list [object [, tool]]object(optional): Filter runs recorded against a specific object.tool(optional): Filter by tool identifier (for example,boltz2ormpnn).
Example output:
PyMOL> metrics_list pred boltz2_1877b875 boltz2 pred/1 n_residues=117, msa_depth/A=1000, elapsed_s=14.1 boltz2_6a86f4b4 boltz2 pred/2 n_residues=117, msa_depth/A=1000, elapsed_s=14.2The third column indicates the target object/state.
metrics_get
Section titled “metrics_get”Retrieves summary scalars or specific arrays from a recorded run.
metrics_get [run [, key [, object [, state [, tool]]]]]run: Run identifier (frommetrics_list). If omitted, RayMol targets the newest run onobjectcontainingkey.key: Specific metric name (for example,mean_plddtorplddt). If omitted, all scalars and arrays in the run are listed.object: Target object name (used ifrunis omitted).state: narrow to one model. Default0means every state; when an object carries several measured states you must name one (or arun=), because RayMol refuses to pick for you.tool: Disambiguates which tool’s measurement to query if multiple tools have evaluated the object.
Examples:
# Print all summary scalars for an object's latest runmetrics_get pred
# Get a single scalar value for state 2metrics_get pred, mean_plddt, state=2
# Inspect a residue-level arraymetrics_get pred, plddt, state=1metrics_color
Section titled “metrics_color”Colors a molecular object using a stored residue-level metric array.
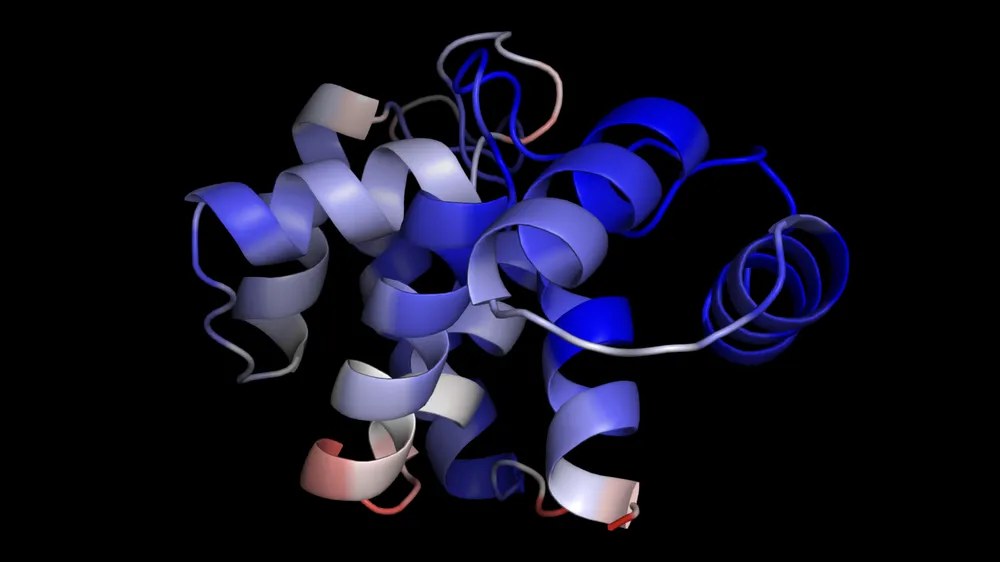 A Boltz-2 prediction colored by pLDDT with
 metrics_color.
metrics_color key [, object [, run [, state [, palette [, minimum [, maximum [, selection [, tool]]]]]]]]key: Residue-scope metric to display (e.g.,plddt,native_fit, orcertainty).object: Object to recolor.run(optional): Specific run identifier.state(optional): Model/state number.palette(optional): Any valid PyMOL palette (defaults toblue_white_red).minimum,maximum(optional): Spectrum numerical range. By default, RayMol uses the predefined expected domain for that metric (e.g.,[0, 100]forplddt,[-6.0, 0.0]fornative_fit), ensuring two different structures or runs color on an identical absolute scale.selection(optional): Restrict recoloring to an atom selection (see Selecting atoms and residues).tool(optional): Disambiguate between tools if multiple have measuredkey.
Examples:
# Color by prediction confidence using default [0, 100] scalingmetrics_color plddt, pred
# Color a specific modelmetrics_color plddt, pred, state=2
# Color by ProteinMPNN native fit scoremetrics_color native_fit, my_design
Only residues actually measured by the tool are recolored; unmeasured residues retain their previous color.
metrics_schema
Section titled “metrics_schema”Displays the declared schema for all tools or a specific tool, including metric keys, scopes, units, descriptions, and expected ranges.
metrics_schema [tool]Example:
PyMOL> metrics_schema boltz2 boltz2 n_residues object residues Residues folded n_chains object chains Chains msa_depth chain sequences Alignment depth used elapsed_s state s Inference time peak_bytes state B Peak memory plddt residue pLDDT Per-residue confidence [0..100] mean_plddt state pLDDT Mean confidence [0..100] pae pair A Predicted aligned error [0..32] mean_pae state A Mean predicted aligned error [0..32] min_ipsae state - min ipSAE [0..1] ipsae state - ipSAE [0..1] ipae state A Interface PAE [0..32]metrics_export and metrics_load
Section titled “metrics_export and metrics_load”Export recorded metrics to disk or import metrics generated from external pipelines.
# Export to CSV (scalars and residue arrays in long tabular format)metrics_export scores.csv, pred
# Export to JSON (full document including 2D PAE matrices)metrics_export scores.json, pred
# Load metrics from an external pipeline JSON documentmetrics_load from_pipeline.json, predmetrics_delete
Section titled “metrics_delete”Removes metrics from the session.
metrics_delete namename: Can be a specific run ID, an object name (deletes all runs recorded on that object), or"all"(clears the entire metric store).
Accessing metrics via Python
Section titled “Accessing metrics via Python”In addition to PyMOL commands, RayMol exposes the metric store directly to
embedded Python scripts, and to the Claude MCP server through its run_python tool.
Using pymol.cmd
Section titled “Using pymol.cmd”The cmd.metrics_get function returns parsed Python dictionaries:
from pymol import cmd
# Fetch a scalar metricmean_conf = cmd.metrics_get(object="pred", key="mean_plddt", state=1)print(f"Mean pLDDT: {mean_conf['value']:.2f}")
# Fetch a residue-level arrayplddt_data = cmd.metrics_get(object="pred", key="plddt", state=1)# plddt_data['index'] contains [["A", "1"], ["A", "2"], ...]# plddt_data['values'] contains [92.4, 88.1, ...]
Using pymol.metrics.store
Section titled “Using pymol.metrics.store”For advanced analysis, import the underlying store module:
from pymol.metrics import store
# Retrieve all runs for an objectruns = store.runs(object="pred")
for run in runs:    print(f"Run {run.id} ({run.tool}):")    print("  Inputs:", run.inputs)    print("  Scalars:", run.scalars())
# Extract residue mappings as dictionariesrun = runs[0]plddt_entry = run.one("plddt", state=1)residue_map = plddt_entry.as_map()# residue_map is {('A', '1'): 92.4, ('A', '2'): 88.1, ...}
# Compare models in an ensemble to find the highest-confidence predictionbest_run = max(runs, key=lambda r: r.one("mean_plddt", state=r.states[0]).value)best_model_state = best_run.states[0]seed = best_run.inputs.get("seed")print(f"Best model: state {best_model_state} (seed {seed})")
Pairwise matrices can be reshaped into NumPy arrays using the index length:
import numpy as npfrom pymol.metrics import store
run = store.runs(object="pred")[0]pae_entry = run.one("pae", state=1)n_res = len(pae_entry.index)pae_matrix = np.array(pae_entry.values).reshape(n_res, n_res)
Session persistence and lifecycle
Section titled “Session persistence and lifecycle”Metrics integrate seamlessly with RayMol’s session management:
- Saved sessions (
.pse): All recorded runs, schemas, input parameters, and arrays are embedded inside.psesession files. When opened in RayMol, all metrics restore completely. When opened in upstream PyMOL, the session loads cleanly while silently ignoring the custom metrics block. - Session reset: Opening a new session or running
reinitializeempties the metric store to ensure old measurements do not linger on unrelated objects. - Object modifications:
- Renaming: Renaming an object with
set_namemoves all its recorded metrics to the new name. - Deleting: Deleting an object removes its associated runs from the store.
- Duplication (
create): Creating a new object from a selection does not copy metrics, because selections may represent arbitrary subsets where residue indices no longer align.
- Renaming: Renaming an object with
- Staleness detection: Metric states are positional. If the number of states or coordinates in an object changes after a metric was recorded, the run is flagged as
staleinmetrics_listandmetrics_getoutput to warn that the measurement may no longer correspond to the current structure.